
AM Browser Insight
Insight is a new type of report, Admin user and Power user can save their own reports. There are two display styles:
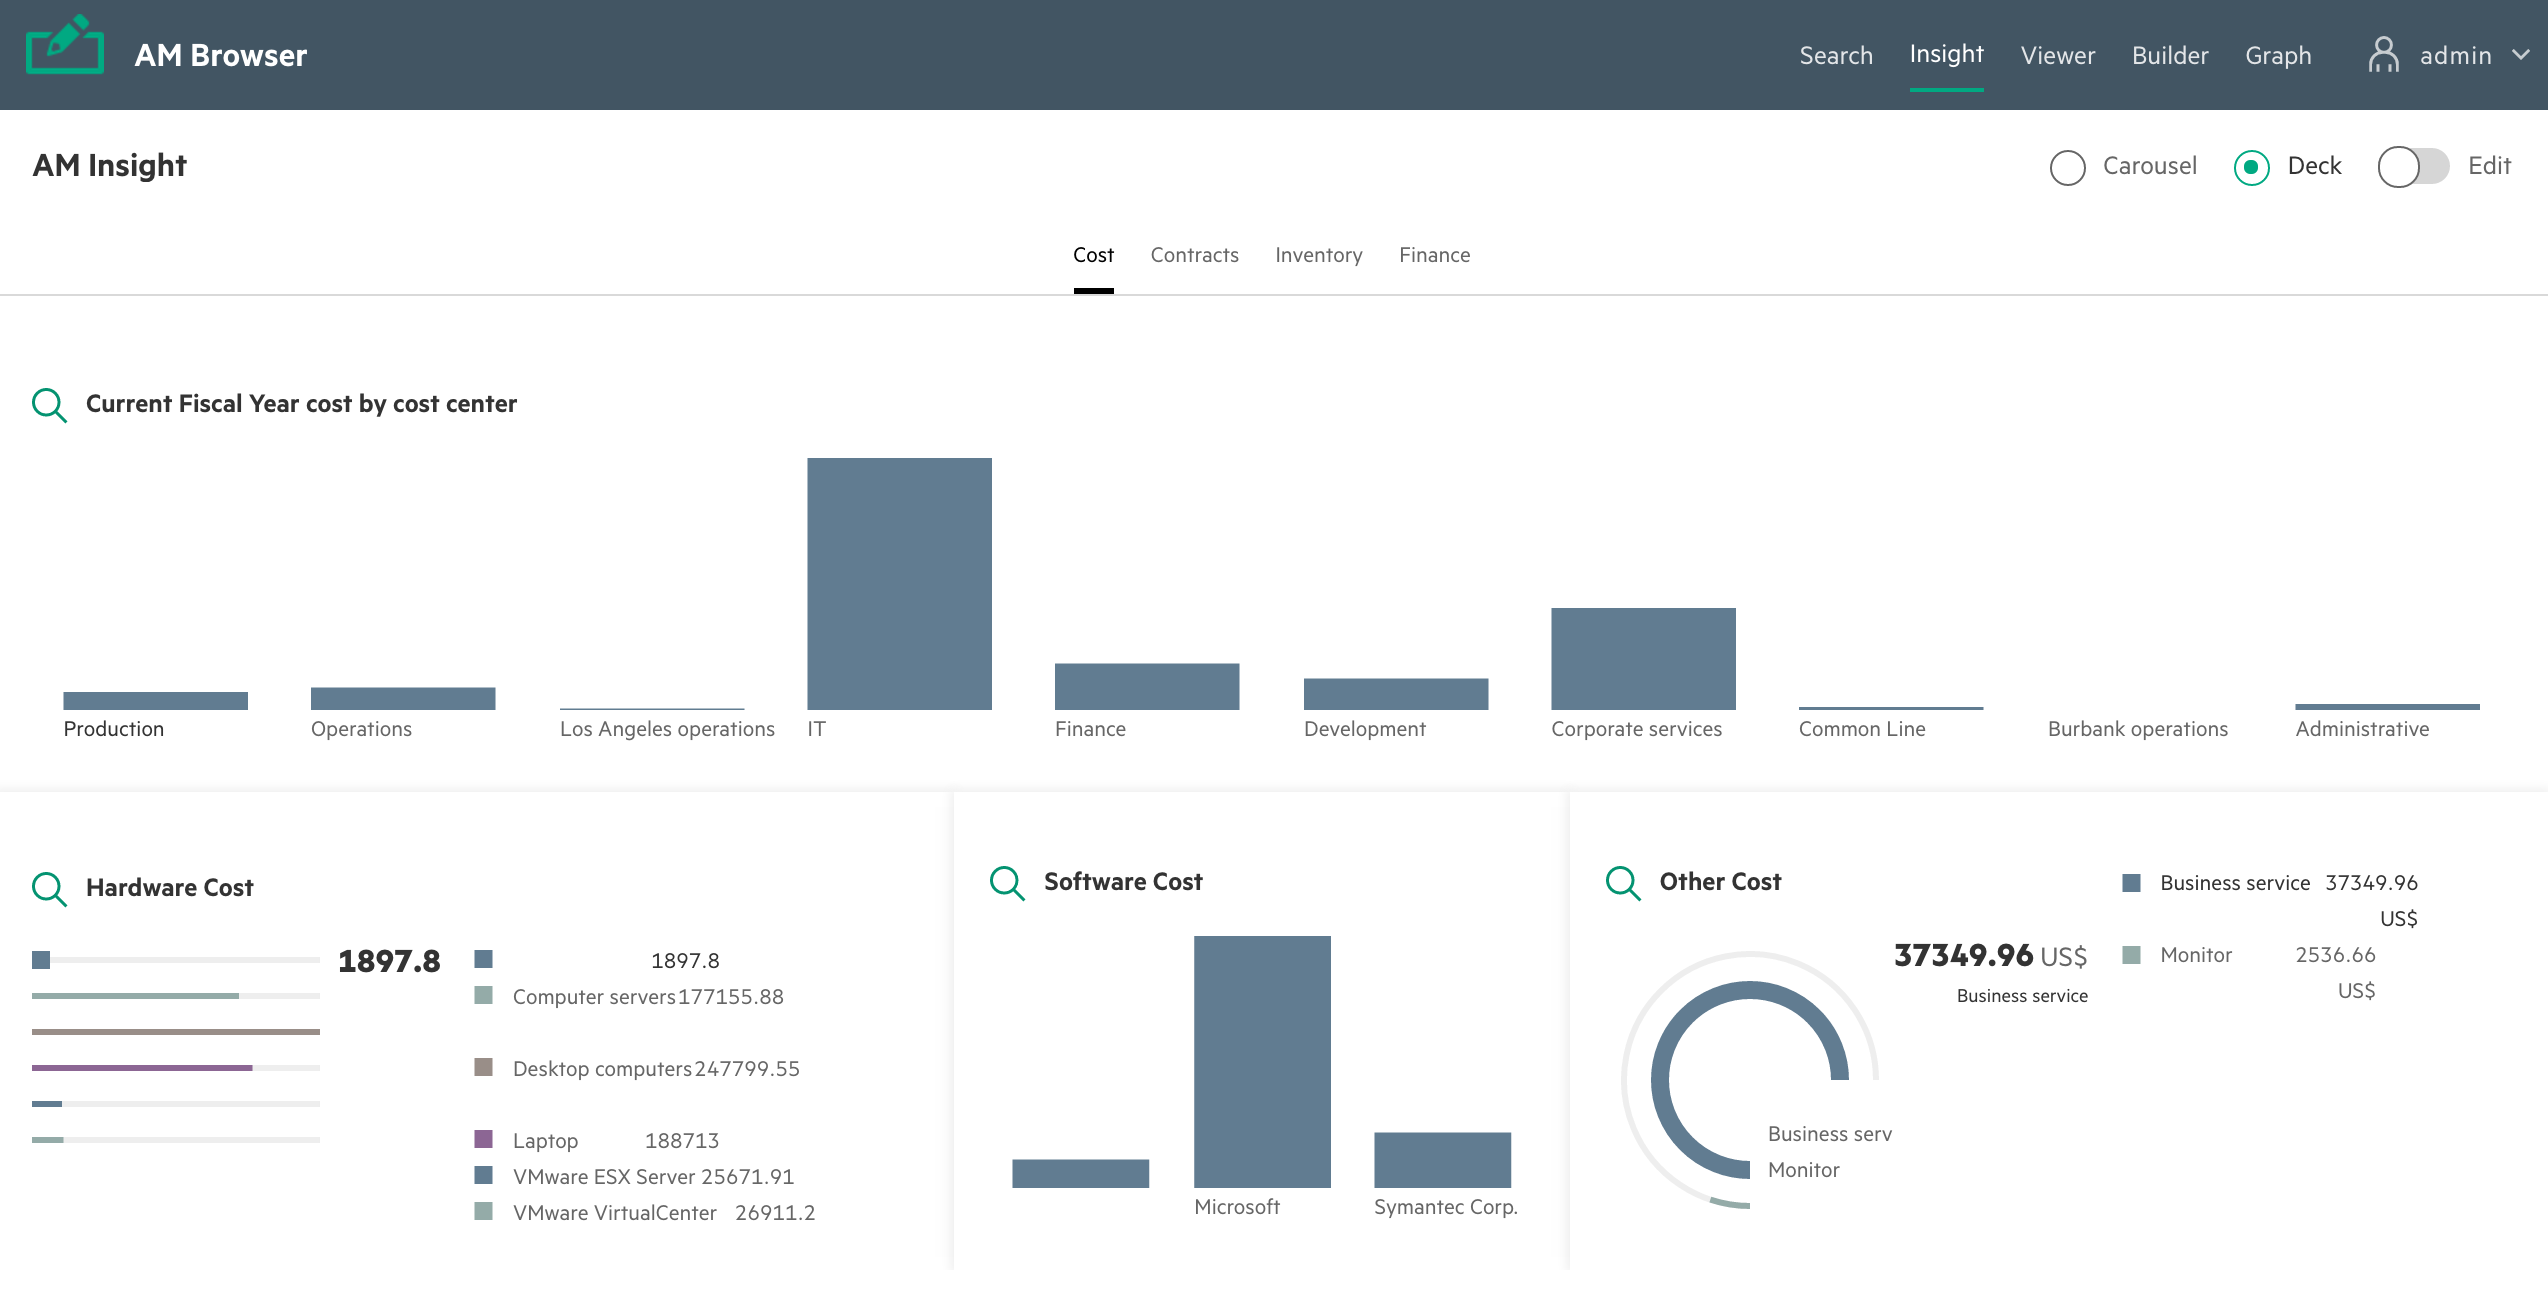
Display styles
- Carousel: Automatically displays Graphs one by one every 10 seconds.
- Deck: Displays Graphs on one page as per designed layout
Carousel or Deck display the Graphs of the selected category.
Category
Based on your business requirement, you can create different category as tabs.
To create a new category, enable the Edit mode and then click Add Tab. In the Edit mode, you can also rename a category by double-clicking it.
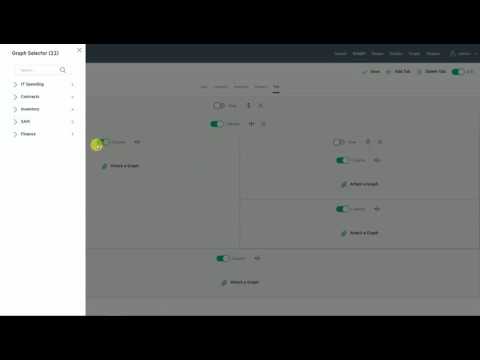
Flexible layout
In the Edit mode, you can create a flexible layout. Each block can be split by row or column. Then, you can attach a Graph.
- Split row
- Split column
- Attach a Graph
- Remove last element
Removing a function will remove its attached Graph or the last block. Block cannot remove itself.
Video:
Attach Graphs
In the Edit mode, you can attach a Graph to any block that does not have a sub block in layout.
Graphs are created in
Graph moduleby AMB Admin.
Single Graph view
Click each Graph title, get a single view to display this Graph with details.